
Recently we were executing a memory usage analysis in my current (node.js) project. This article summarizes some of our findings, which may be useful to other projects. It does not describe the very basics of the mark-and-sweep garbage collection algorithm. Instead, it focuses on the details of the particular tools we used.
Chrome developer tools
Chrome developer tools have great heap snapshot section, which can be used to analyze heaps of both browser and server (node.js) applications. It can be used to record JavaScript heap snapshots of a running process or to load existing snapshots, recorded by other tools. It is available already for several years and is extensively described on the Internet. Still, there are parts of this tool, which don’t have a proper description and, overall, it may be a bit overwhelming in the beginning. So here is a very simple HTML document example, which may help in understanding Chrome heap snapshot views.
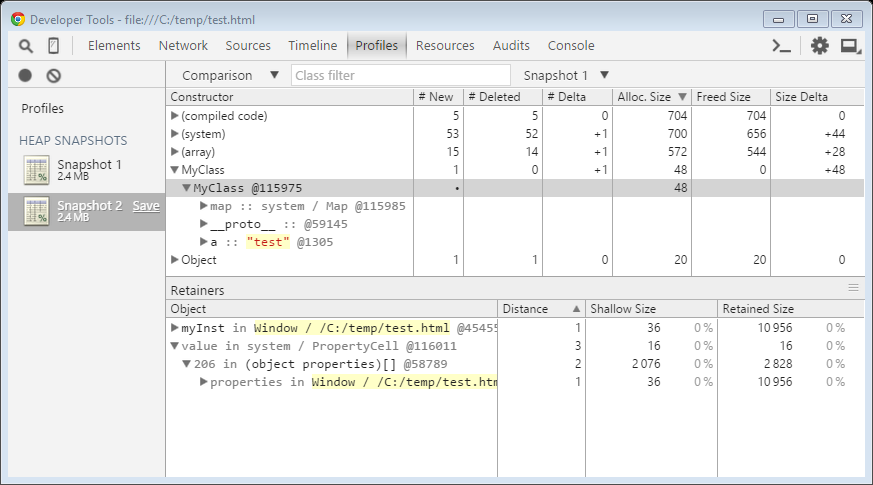
A script in this document simply creates an instance of an object, using constructor function and assigns it to the global scope. If you click on “Action” and then “Set and clear” button to force browser do its initial compilation work, then record first heap snapshot, then click on “Action” button and then record second heap snapshot, you could see something similar to the picture below. Just select the second snapshot in the left menu, then select “Comparison” view and then select the first snapshot as comparison target in the dropdown, next to class filter input box.
 Chrome developer tools
Upper table shows the difference between two snapshots. All objects (either new or deleted in the second snapshot) are grouped by constructor function name (just as in Summary view).
The first column (“Constructor”) is a tree view. On the first level, you can see constructor function name (object instance grouping parameter). On the second level, you can see instances in the selected group (each instance has a unique id with “@” prefix). On the third level, you can see properties of the instances, then, on the lower level – properties of the corresponding objects and so on.
Further columns in the upper table describe the difference in the number of instances and the total size of each group (on the first level). On the second level, you can see whether a particular instance is new or has been deleted between the compared snapshots.
The lower (“Retainers”) table is also a tree view. On the first level, you can see a list of paths from the selected instance to the root object, which causes this instance not to be marked as garbage by the garbage collector. The tree under each top level node describes the path to this root. In the picture above, you can see that instance of “MyClass” with ID “@115975” is “retained” through a property “myInst” on root object “Window”. Distance “1” means that this instance is directly referenced by a root object. It is interesting to see that there is also another, system retaining path for this instance (second top level record in the “Retainers” table). It is not directly visible to JavaScript, but it is shown in this view nonetheless.
Analyzing node.js heaps
What is great about node.js is that not only you can build server-side using the same language (JavaScript, CoffeeScript, TypeScript, etc.) and libraries as you use for “browser-side”, but also that you can use the same tools to debug and analyze it.
There are a lot of articles, which describe how you can attach a debugger to a new or running node.js process and then either debug or record heap snapshots. What is slightly less known, is that you can actually programmatically record heap snapshots without the need to attach a debugger. That is very easy to do using “heapdump” NPM module (https://github.com/bnoordhuis/node-heapdump).
For example, you can simply create a new route, which can be called anytime and will create a new heap snapshot file on disk. It can even be used in production (if you closed it from unauthorized access, of course):
router.get("/heapdump", function (req, res, next) {

    try {

        require("heapdump").writeSnapshot();

        res.json("done");

    } catch (e) {

        next(e);

    }

});
Using this heap dumping technique, we have very easily found that many of our processes store big unused “geoip” data files in RAM since corresponding library loads them into memory non-lazily. Simply removing these files, greatly reduced the memory consumption of our application.
 |
About the author: Konstantins Onufrijevs is a solutions architect and a software developer with more than 10 years of professional experience in the field, currently specializing in full-stack web development with .NET and JavaScript back-end. He has been working for Idea Port Riga since August 2010. |


