
Suppose that weeks of developing business processes, building user interface and integrating Siebel with other systems are gone at last; implementation can be considered completed, and users have started to work with Siebel. There are no fatal bugs, nor annoying performance issues. Still, there can be something left to improve, specifically ergonomics of your Siebel implementation – and, possibly, efficiency of users' actions and operations in Siebel.
At the moment, we can typically only imagine more or less clearly what does a user's working day look like from Siebel perspective – which views are visited more often (while some others may remain virtually unattended), how many queries of different types are executed in an hour, and so on. We could sit behind a user all day long with a notepad to make marks and records, but it is definitely not a praiseworthy approach for IT. Instead, it would be great to have an automated system for collecting statistics of users' actions in Siebel, which should be as light-weight and transparent as possible.
There can be another argument in favor of having such a system, which relates to a more delicate issue, namely protecting customers' private data in accordance with the laws. In some countries, enterprises are obliged by legislation to track and keep records of accessing customers' private data. Indeed, while consulting a large-scale enterprise, we’ve got a requirement to implement such auditing system for them.
Quite soon, we had found that Siebel out-of-the-box functionality of Audit Trail did not really satisfy the requirements. First, it was designed mostly to log changes in records, not searching for data or navigating to views. Second, it would affect performance too much, as well as require additional storage capacities for Siebel DB servers.
To avoid negative impact of logging on performance, it was decided that the logging system should work as separately from Siebel infrastructure (Siebel servers and Siebel DB) as possible.
We considered using external Application Performance Monitoring software packages, such as Oracle Real User Experience Insight, to intercept and analyze network traffic between user stations and web servers and retrieve the required information about users' actions from it.
However it appeared to be a complicated and demanding task because of a number of implications like taking into account possible changes of communication protocols (or using encrypted communications), necessity of analyzing data on a very low level and additional investments in software licenses. Moreover, it turned out that we could not retrieve field values or search specifications with this approach, therefore deeming it unsatisfactory for our purposes.
Instead, after some investigation, we have fulfilled the requirements by implementing some additional logic on UI layer, which is to call a lightweight Web service by sending simple 'fire-and-forget' HTTP requests every time when a user action takes place (see the green path on the picture below). The requests are routed differently from Siebel conventional traffic because of a different endpoint. This way, no additional load is put on top of the Siebel infrastructure. This approach has become possible only since Siebel Open UI has been released.

Currently, the functionality is triggered and the event is logged in the following cases:
- a user navigates to a view; the name of the view is recorded
- a user runs a query; the search specification is recorded
- a user selects a record (or drills down); specific field values are recorded
- in some cases we also measure and record execution times for specific queries using the same interface
For instance, when a user runs a query from an applet of ‘All Account List View’ with search specification ‘[First Name] ="Carl" ‘, a HTTP POST request is sent to log the following parameters:
- action: "ExecuteQuery"
- applet: "SIS%20Account%20List%20Applet"
- context: "%5BFirst%20Name%5D%20%3D%20'Carl'"
- environment: "SBL_DEV"
- login: "MAKSKRAI"
- type: "audit"
- view: "All%20Account%20List%20View"
Naturally, the transmitted information can and should be encrypted using an algorithm of your choice; also, the list of captured events can be extended, if needed.
We are using a REST Web service (written in Python) to capture HTTP requests for logging; the other important component of the system is Elasticsearch, which is a search server based on Lucene, and Kibana, providing a user-friendly GUI to analyze the gathered data. Kibana windows with pre-generated queries were made available for being operated directly from Siebel administration views, accessible to the responsible managers:
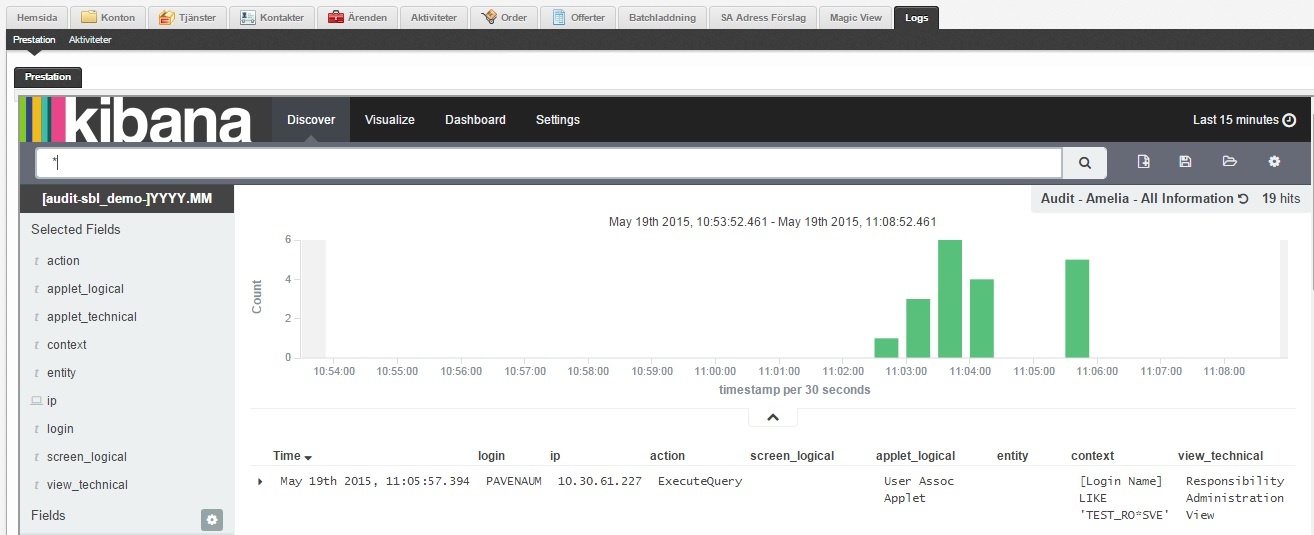
Thus, Siebel performs as both the source and the receiver of the data, delegating all the processing outside. The functionality can be switched on and off from a Siebel administration view in real time. According to our analysis, the system can generate and process up to 860,000 events per hour. And it can work on any platform, where Open UI works without any installations on user side!
Have questions or comments on the subject? Don’t hesitate to get in touch with us!
 |
About the author: Maksims Krainovs has been with Idea Port Riga since 2009, while his Siebel experience spans a few more years beyond that. He possesses deep knowledge and experience in both Siebel customization and development, as well as in integrating Siebel with other systems and administration of Siebel servers. |


