
The insurance fraud problem is as old as the insurance industry itself. The magnitude of insurance fraud today is enormous, and it is not limited to a single geographic location. One company investigated an average of 300 suspicious claims a month in Slovakia in 2009 – and that is just one insurer in one small country of just over 5 million inhabitants.
Insurance fraud accounts for at least 10% of all insurance premiums, a percentage that has remained relatively constant over the past two decades. But in reality, the full scale of insurance fraud is unknown. Here we are going to show how to help to identify the fraud in Insurance claims using Oracle Advanced Analytics (OAA) and Data Mining techniques. This is a Proof of Concept (PoC) that we have delivered to an insurance company after a couple of months of work. It is an ongoing project now, and with this article we would like to share the experience. There are still lots of work to do though to make this project successful, and the real business value could be calculated only after some time of use.
The foundation of this PoC is Data Mining – a process of discovering patterns in raw data using data modeling techniques like classification, clustering, regression modeling and others. Data Mining has a wide range of applications, such as credit risk analysis, fraud and anomaly detection, market basket analysis, product recommendation and so on.
Like many other product development processes, Data Mining has own process standard called CRISP – Cross Industry Standard Process for Data Mining. This is how it looks like on a high level: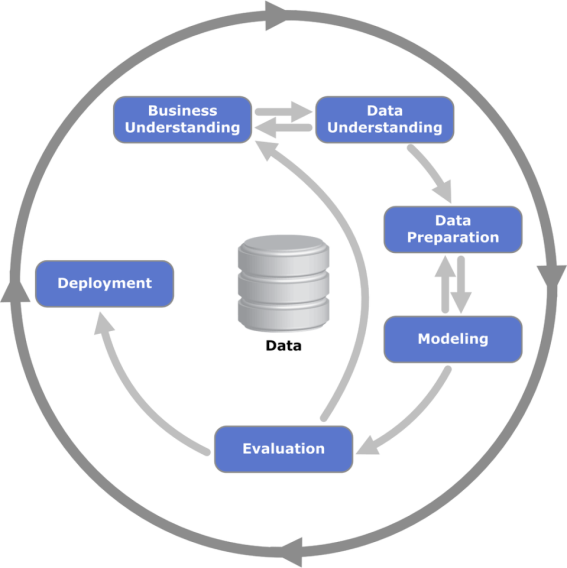
Basically, this is a sequence of phases ranging from Business Understanding to Data product deployment. The sequence of the phases is not totally strict, and moving back and forth between different phases is possible. The arrows in the process diagram indicate the most important and frequent dependencies between the phases, and the outer circle in the diagram symbolizes cyclic nature of the whole process itself.
Business understanding is the initial phase, and it focuses on understanding the project objectives and requirements from a business perspective. The data understanding phase starts with an initial data collection and exploration. The data preprocessing phase covers all activities to construct the final data set like data cleaning, normalizing, feature selection, sampling, etc. In data modeling phase various modeling techniques are selected and applied. Evaluation phase is important for model assessment and understanding whether this model fits business objectives (meaning, whether the success criteria are met). And the last phase is deployment, where the data product is presented to a customer.
But enough with the theory! Let’s jump in our case, and see how fraud detection for insurance claims (auto insurance) can be implemented – nicely mapped onto the phases of the CRISP process.
Business understanding
This solution is aimed to provide a tool for insurance company’s security service to help in identifying fraudulent claims in case of auto insurance, also known as voluntary vehicle insurance, GAP insurance or KASKO. Since the client has Oracle product stack with Oracle DB 11g, Oracle Advanced Analytics, Oracle Business Intelligence (OBIEE 11g), the choice of toolset was sort of obvious. We have utilized all advantages of this stack and used Oracle Data Miner for Data Mining modeling, as well as OBIEE for results discovering. More information will follow.
As the goal of this analysis is to help in identifying possible fraudulent claims, we didn't limit ourselves with delivering only the prediction of the possible fraud, but included also a descriptive part, which answers the questions like where and how the fraud is likely to happen. So the main deliverables for the PoC are:
- possible fraud prediction
- fraud descriptive analysis
In terms of the project role, this phase of the CRISP model is where 50 % of the business analysis happens.
Data understanding
Major amount of time is typically spent on data understanding and data preprocessing phase. With OAA you don’t need to worry about moving your data to support third party software, you just do your analysis within one database. It saves time.
For the initial data collection we have gathered a sample of 400,000 claims with 250 attributes, where 4% of them were known to be fraudulent. The main source of data was Oracle Siebel CRM. To form initial data collection of 250 attributes we had to analyze and transform meaningful attributes from Siebel data entities like Claims, Policy, Policy Coverage, Organizations, Contacts – and more.
In our case the client has already identified fraudulent cases (4% of the initial sample), and that meant that the problem might be addressed using supervised learning techniques.
In this phase the business analysis ends, and all business findings are being delegated to data analysis.
Data preprocessing
In order to form the final data set that could be used for modeling, you have to perform a lots of activities like data cleaning and normalization, input of missing values, as well as transforming your 1-to-many relations into 1-to-1 cases. Only then you could test your attributes against goal variable to filter out unnecessary variables that do not add any value to the model. Here we have applied an attribute selection technique (also known as feature selection or dimensionality reduction), which allowed us to filter out 100 attributes.
Because of the unbalanced nature of initial data, where 96% is normal claims and only 4% is fraud, we had to balance the influence of both classes (fraudulent and normal). Here we have applied bootstrap sampling that allows increasing the size of your training data set by (uniformly) randomly selecting items and duplicating them (with replacement). The final data set was split into training and testing data sets (70% vs. 30%).
Just to mention, Oracle Data Miner has a pre-built data preprocessing capacity that offers automated preprocessing – such as data normalization, attribute importance and more. Again, it saves your time.
Modeling
Initially, our client had a scoring model based on business rules that were created based on their business assumptions. We have expanded this model with two additional models using classification and clustering techniques. For predictive purposes, to combine advantages of all the models, the final model was built on top of that – using ensemble technique and voting: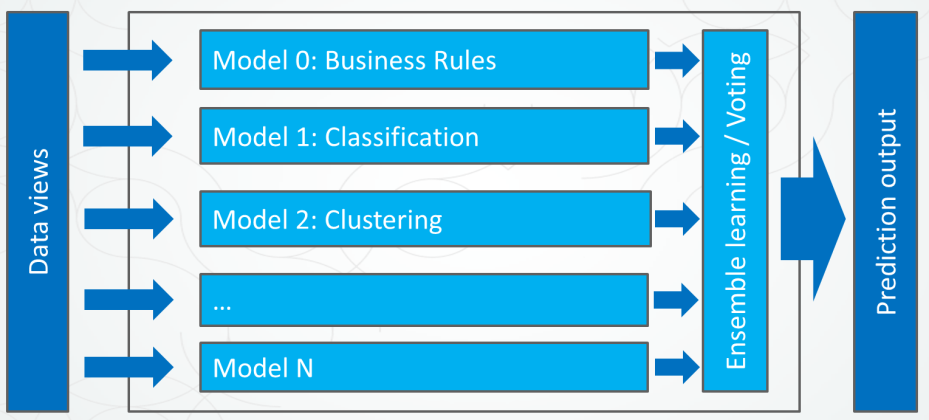
For descriptive purposes, the results of clustering and classification were used to analyze the contents of extracted patterns. With this modeling we are trying to find the common patterns of the fraudulent insurance claims: having extracted those patterns from the raw data, we could use them to predict possible upcoming fraud.
As was mentioned earlier, we have expanded the initial scoring with two models, utilizing two completely different Data Mining techniques:
- Classification
- Clustering
Classification is an example of so called supervised learning, where we train the model to classify the cases based on known outcome, whereas clustering is an unsupervised learning technique, where we group all cases based on similarity – without knowing the outcome. The main idea here is to combine the result of different data mining techniques to produce better results. And since we have binary classification problem at hand (fraud vs. non-fraud), we are using voting technique to combine the results of all models.
Oracle Advanced Analytics
Before moving on, let’s have a brief overview of what Oracle Advanced Analytics is, and what this product has to offer. Basically, Oracle Advanced Analytics is an option to your Oracle database that provides a set of Data Mining functions (DBMS package). This package provides 15 functions to support basic techniques of Data Mining – such as classification, regression, clustering, association rule learning, attribute importance and other:
Users can access OAA through four main access points. First, the Oracle Data Miner GUI provides simple drag and drop access for business analysts. R developers can use the R console or R Studio to write R scripts that get trapped, transparently converted by OAA to SQL and then executed inside the Database. Business users and application users can access OAA’s insights and predictions via OBIEE and other applications.
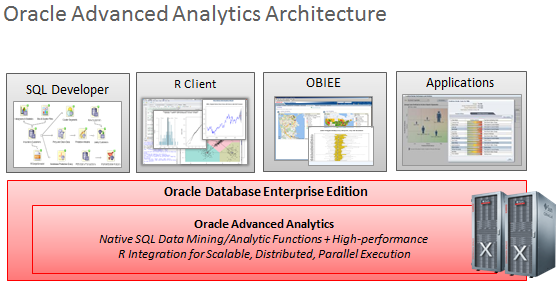
This so called in-database analytic tool allows utilizing all the benefits of Oracle database, such as scalability and parallel execution. Moreover, Oracle Data Miner is equipped with a workflow-style GUI that contributes to minimizing data modeling time: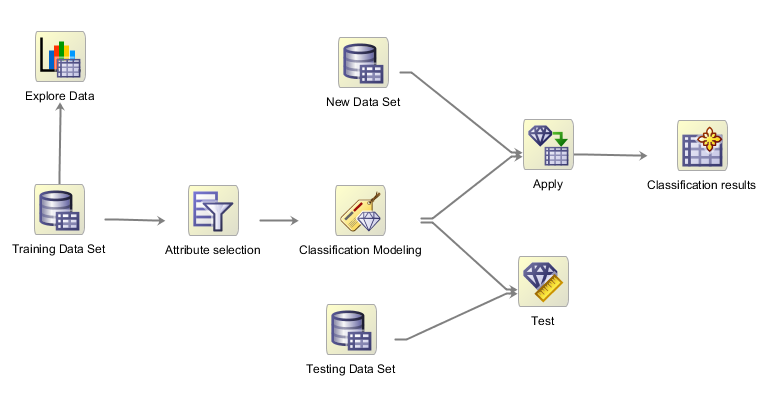
As you can see, Oracle Data Miner’s workflow style simplifies your modeling and is rather straightforward to interpret. It is easy to follow what was done before training the model. This is really important because it makes your analysis reproducible, and – once again – this also saves your time during the inevitable knowledge transfer!
Oracle Data Miner offers you the choice of four classification methods, which are: Decision Trees, Generalized Linear Model, Logistic Regression (GLM), Naïve Bayes and, finally, Support Vector Machines (SVM). During the modeling you can take them all and train your models in parallel. For comparison we have built three classification models in parallel: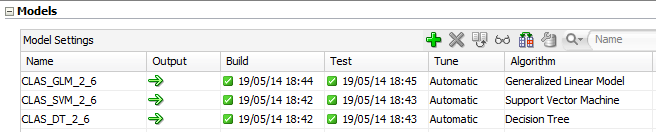
The results of model validation we’ll see in next step – the evaluation.
Evaluation
On this stage you can see the comparison of the three models: Support Vector Machines, Decision Tree and Generalized Linear Model. This is a result of the model validation performed on the same test data set, for which we know the actual outcome (fraud or not):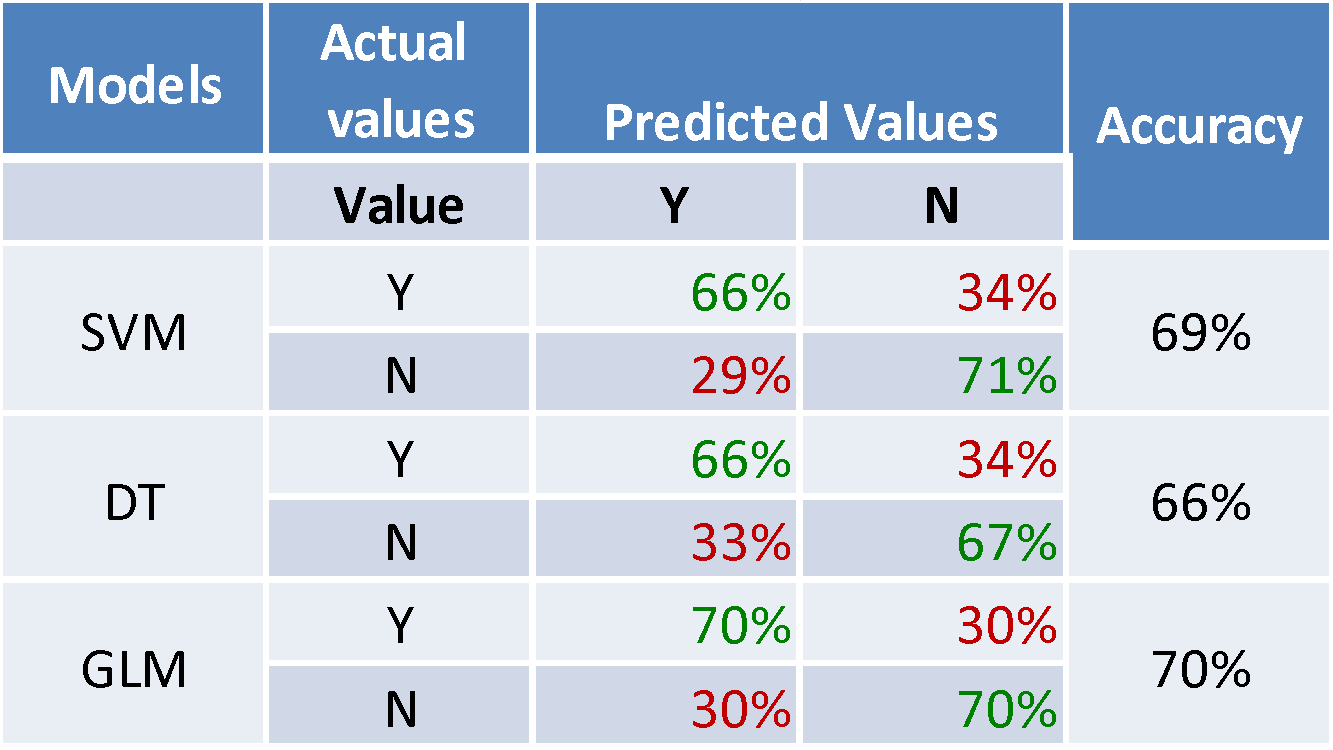
Since we have a binary classification in place, there are exactly two classes: fraud or not denoted by ‘Y’ and ‘N’. This table shows how accurate we can predict each class using these models. For instance, SVM predicts 71% of normal cases and 66% of fraud cases with a total accuracy of 69%. GLM model predicts 70% fraud and normal cases with an overall accuracy of 70%. In certain situations some of the business scenarios might require better accuracy for a particular class, for instance class ‘N’ – where SVM model would have been clearly preferable.
In some cases the goal of the analysis is to minimize False Negative Rate (type II error), i.e. the number of actual fraudulent claims that we cannot classify as a fraud, in other words the case where actual value is ‘Y’, whereas the predicted value is ‘N’. This type of error in most business scenarios is more expensive than the False Positive Rate (type I error), i.e. the case which is classified as fraud, when it actually isn’t such.
Using this type of validation (confusion matrix) you can easily estimate your total business value by multiplying each rate by an estimated cost. However, we wanted to achieve a better overall accuracy, and that’s why we have chosen GLM for further analysis.
The second model we looked at was cluster modeling. This is a representative of so called unsupervised learning methods, a completely different technique. Basically, here we group cases based on some sort of similarity, forming clusters, and then examine each cluster for fraud.
In our particular case we have formed 15 clusters, and here you can also see a balance between fraud and normal cases within each of the clusters: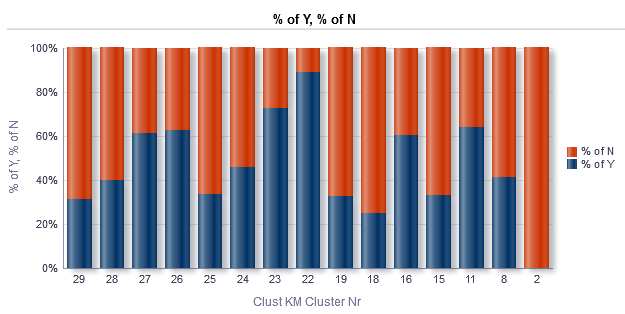
For better understanding, simply imagine that each cluster as a behavioral pattern that people use for insurance claims. Blue color denotes the percentage of fraud from total number of cases within the cluster, and the red bar – the percentage of normal (non-fraudulent) claims accordingly. We see that cluster Nr. 22 has more fraud in it than others. So this is the evidence that patterns in fraud behavior do exist. We’ve selected this cluster for the further analysis.
As the goal of the project was not only to predict fraudulent behavior, but also to provide facilities for insurance company’s security service to analyze why these claims identified as fraudulent, the results of the analysis were integrated into a BI solution, allowing users to have more insights from the modeling results. For example, this is how the dashboard in OBIEE looks like, displaying the details of the 22nd cluster: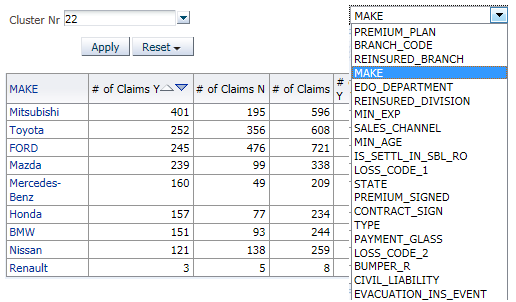
On the right side, you can see a list of attributes and their support and confidence levels related to the selected cluster. Also we can see the distribution of attribute values within this cluster.
As a result of prediction you can get the list of fraudulent claims that needs your special attention. For example, you can select the list of the cases based on prediction of two models, where classification model gives you cases classified as a fraud with probability greater than 90%, and also clusters Nr. 22 and 23, which are most likely to fit into a fraudulent pattern. This is where we apply this analysis: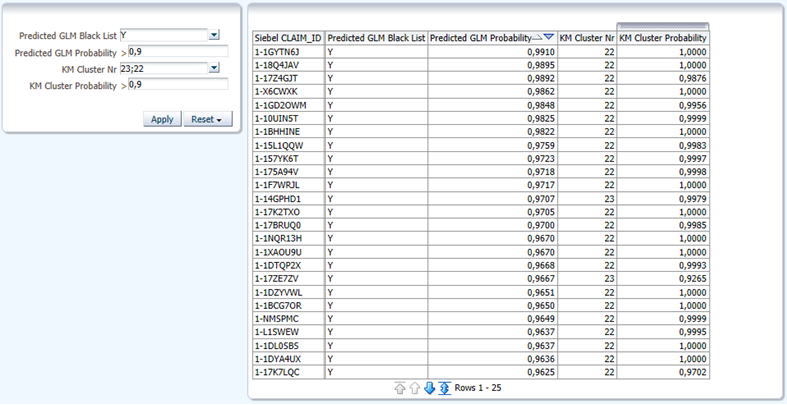
The first scenario is integration with your BI/DWH star schema in order to slice and dice the results, and the second scenario is real-time prediction during the claim registration process within the CRM system.
Conclusion
This article intended to show you how easy it is to enrich your Business Intelligence solution using basic Data Mining techniques and Oracle Advanced Analytics. Treat this Proof of Concept as a general philosophy that can be adopted to solve various problems. Of course there are a lot of other more advanced Data Mining techniques that can provide a more accurate result, compared to what was shown here, but either way the most important aspects are data analysis/preprocessing and a choice of an optimal modeling strategy.
As far as the tools go – if you are fine with list of methods that Oracle offers you, then OAA is a pretty good for modeling, guaranteed to save some of your time and help to quickly deliver your PoC.
Of course, there are many questions kept uncovered intentionally, like choosing the number clusters for K-means clustering and more. So if you find it promising, don’t hesitate to get in touch and request the details or assistance! And check out this slide deck, presented on Oracle Innovation Days 2015 in Riga:
 |
About the author: Jurijs Jefimovs is a systems analyst working at Idea Port Riga since February 2009, focusing on Business Intelligence, Data Warehouses and Data Mining solutions. His experience spans different private and public sectors, such as Insurance, Energy and Finance. In terms of education, he holds Master’s degree in Computer Science, majoring in Statistics and Data Mining. |


